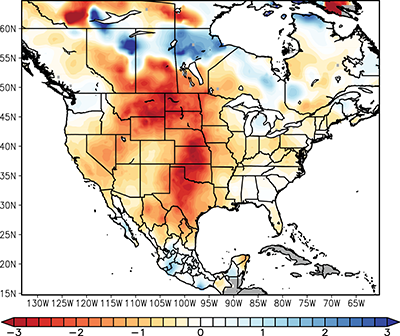
Civil War Drought 1856-1865
June-August PDSI |
Welcome to the North American Drought Atlas. This
web application provides access to summer (June-August) reconstructions of the
self-calibrating Palmer Drought Severity Index (PDSI) on a 0.5°
latitude/longitude grid centered over North America from AD 0000-2005. The
reconstructions are derived from 1,845 tree-ring chronologies. For further details on the reconstructions, see Cook et al. (2010, link below).
Maps and time series can be created using tools under the "Maps" and "Time
Series" menus, respectively. For details on how to create maps and time series,
see the "Help" menu. An animation that runs through each year of the
reconstruction from AD 0000-2005 is available via the link below.
Questions, comments, or suggestions may be sent to Dorian J. Burnette.
Citations
- Dataset: Cook, E.R., R. Seager, R.R. Heim Jr, R.S. Vose, C. Herweijer, and
C. Woodhouse, 2010: Megadroughts in North America: placing IPCC
projections of hydroclimatic change in a long-term palaeoclimate context.
Journal of Quaternary Science, 25, 48-61. [Download pdf]
- Web App: Burnette, D.J., 2021: The Tree-Ring Drought Atlas Portal: gridded drought reconstructions for the past 500-2000 years.
Bulletin of the American Meteorological Society, 102, 953-956. [Download pdf]
The entire dataset can be downloaded from NOAA Paleoclimatology. |